TL;DR
- Newer releases were slower at high and max effort in all three dated snapshot comparisons. From August 16 to November 2, 2026, max latency rose 12.6 times for Opus, 3.6 times for Sonnet, and 2.2 times for GPT. Sonnet at high barely moved.
- An Intelligence Index floor did not bound latency. Claude 5.5 rows at or above 50 ranged from 37.6 to 734 seconds. The largest increases appeared at high and max effort.
- A leaderboard cannot tell you whether delivery slowed. Log calls per task, pass rate, review rounds, and minutes to merge. Test those outcomes before retiring a setting.
Our team was routing Claude work to high and max effort while requiring an Artificial Analysis (AA) Intelligence Index above 50. Calls felt slower after model upgrades. We wanted to know whether the releases had actually slowed and whether the +50 rule was helping.
Public snapshots show where the wait changed, but they cannot isolate the cause. A team experiment must decide whether the routing rule helps delivery.
What changed at the same effort label
I compared end-to-end response time for matching effort labels in AA’s August 16 and November 2 captures. AA defines end-to-end time as input processing, reasoning, and answer generation. These are uncontrolled snapshots: model releases, provider infrastructure, traffic, and benchmark operations may all differ between dates.
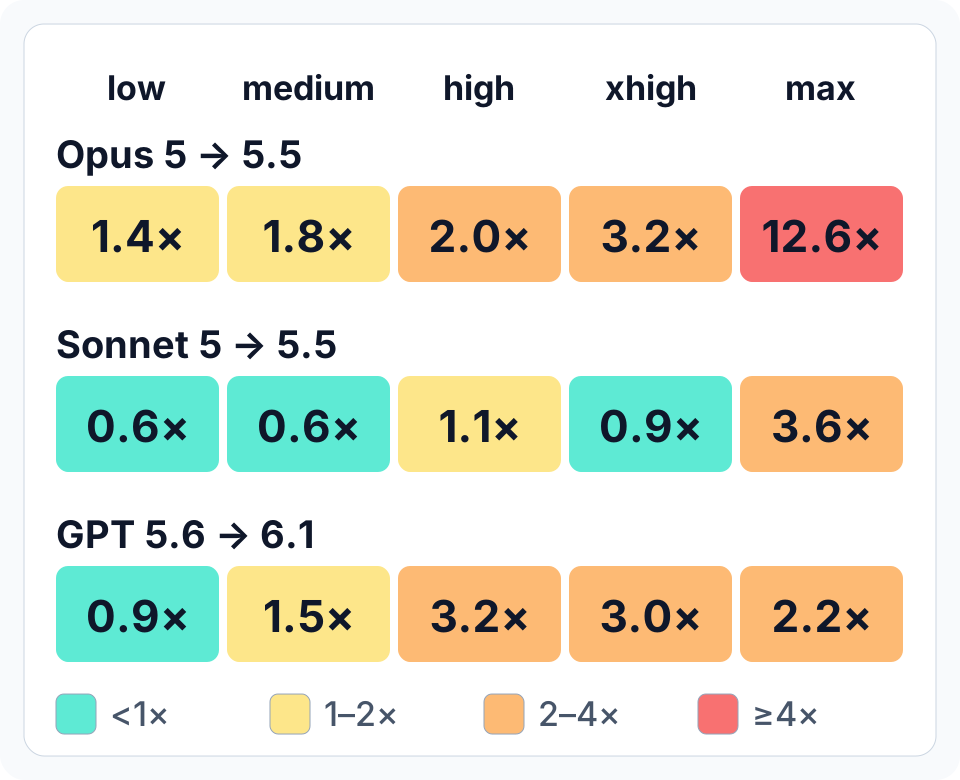
End-to-end latency ratio, November 2 snapshot divided by August 16 snapshot. Values above 1 mean the later row took longer. Ratios use AA’s unrounded values. Color bins are below 1×, 1–2×, 2–4×, and 4× and above; the printed ratio is the exact value.
Upgrade ratio chart data
- Opus 5 to 5.5: low 1.4×, medium 1.8×, high 2.0×, xhigh 3.2×, max 12.6×.
- Sonnet 5 to 5.5: low 0.6×, medium 0.6×, high 1.1×, xhigh 0.9×, max 3.6×.
- GPT-5.6 Sol to GPT-6.1 Sol: low 0.9×, medium 1.5×, high 3.2×, xhigh 3.0×, max 2.2×.
High and max became slower in all three model lines. The increase was not uniform: Opus at max jumped from 58.5 to 734 seconds, while Sonnet at high moved only from 16.1 to 17.3 seconds. Low and medium moved in both directions.
The high and max values show the scale. Opus moved from 26.8 to 53.8 seconds at high and from 58.5 to 734 at max. Sonnet moved from 16.1 to 17.3 and from 142.4 to 519. GPT moved from 24.5 to 77.1 and from 149.9 to 337.
This is not a universal rule for upgrades. The previous GPT step went the other way: GPT-5.6 Sol cut the high and xhigh waits by more than half compared with GPT-5.5. I paired those releases by name; AA does not state that they are a controlled before-and-after pair.
AA’s first-chunk median rose alongside most of the total median increase. Dividing those two changes gives at least 84% for every row where total time rose. This is not a decomposition of one request: the leaderboard reports separate medians, and it does not say whether first chunk means the first reasoning token or the first answer token.
AA’s reported post-first-token throughput rose at every effort label for both Claude lines. Opus at max increased from 62 to 96 tokens per second, about 55% on AA’s workload. That is directionally consistent with Anthropic’s claim that Opus 5.5 generates output more than 30% faster than Opus 5, but the workloads differ.
Stable names were mostly stable at the median. Across five capture pairs, the median ratio stayed between 0.97 and 1.03. The tail still moved: nine of 33 same-name rows at least doubled. Sonnet 5.5 at max, for example, rose from 389 seconds on October 16 to 519 seconds on November 2, while high stayed between 16 and 18 seconds from August through November.
The practical signal is narrow: recheck high and max after an upgrade. Do not assume that every setting became slower.
Why the +50 rule fails
The November 2 Claude 5.5 snapshot makes the problem visible. Within this snapshot, every row uses the same Index version.
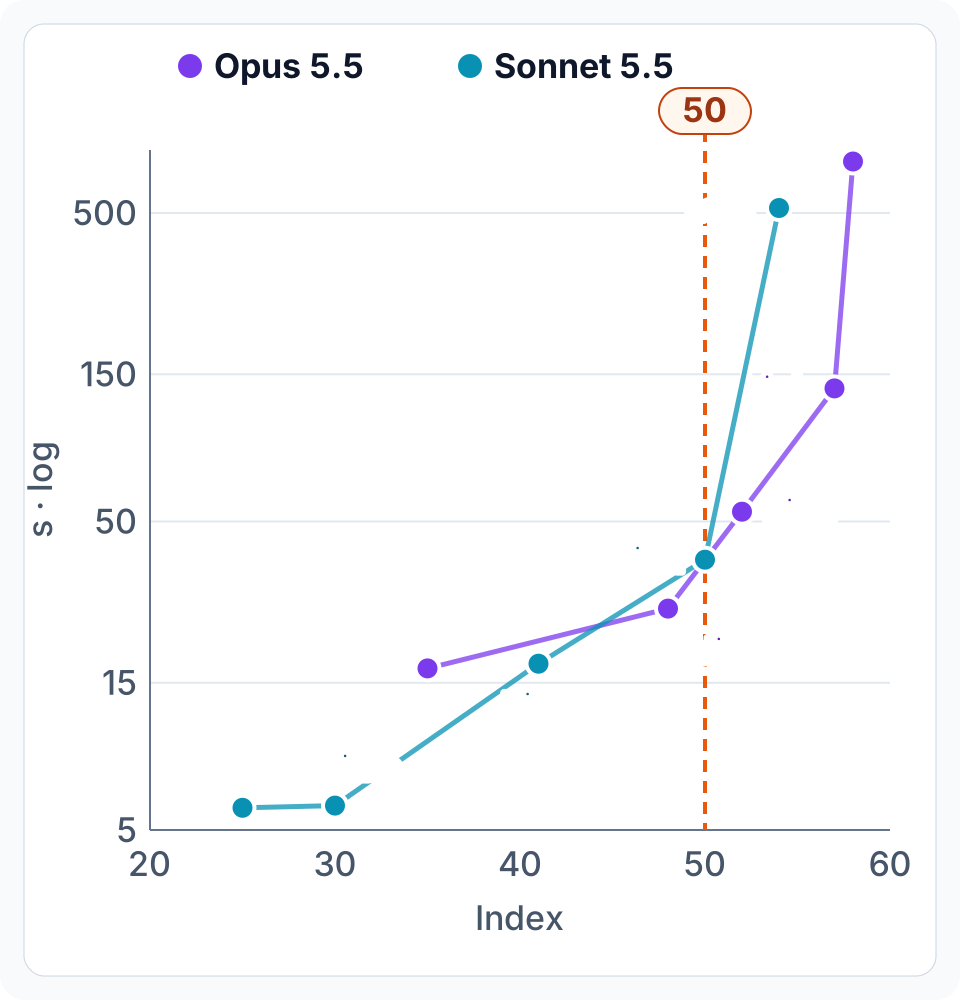
Claude 5.5 effort settings on November 2, 2026. The latency axis is logarithmic, and the vertical line marks an Index of 50. Lines connect categorical effort levels; they do not imply a continuous fit.
Index and latency chart data
- Opus 5.5: low 35 / 16.7s, medium 48 / 26.1s, high 52 / 53.8s, xhigh 57 / 135s, max 58 / 734s.
- Sonnet 5.5: low 25 / 5.9s, medium 30 / 6.0s, high 41 / 17.3s, xhigh 50 / 37.6s, max 54 / 519s. Each pair is Index / end-to-end latency.
Rows near the line have very different waits. Sonnet xhigh sits at 50 and takes 37.6 seconds. Opus high scores 52 and takes 53.8 seconds. Sonnet max scores 54 and takes 519 seconds.
The strongest counterexample is Opus xhigh versus Sonnet max. Opus scores higher (57 versus 54), waits less (135 versus 519 seconds), and costs less in AA’s benchmark ($6.05 versus $10.02). It wins on all three AA metrics, though that does not prove it will perform better on our tasks.
The GPT rows show the same spread. GPT-6 Astra at medium scores 51 and takes 13.9 seconds; GPT-6.1 Terra at max also scores 51 but takes 269 seconds. An Index score can filter for benchmark quality. It cannot serve as a latency policy.
Even crossing the line does not separate score from effort. Opus medium to high moves from 48 to 52 Index points while latency rises from 26.1 to 53.8 seconds. Sonnet high to xhigh moves from 41 to 50 while latency rises from 17.3 to 37.6. Those two pairs suggest effort is the lever, but they do not prove it.
The floor also moves when AA changes the Index. Opus 5.5 at medium scored 51 on October 16 and 48 on November 2 after the move to version 5.0. The model label stayed the same; the score crossed our routing line.
In this snapshot, effort aligns more closely with the wait than the +50 floor does. Across nine model families with both settings, eight took 17 to 88 times as long at max as at low for 11 to 29 more Index points. Max may still earn that wait, but the score alone cannot prove it.
What the benchmark cannot tell us
These comparisons have four important limits:
- Index versions changed. AA published Index 5.0 on October 27. A score change across captures does not prove that model quality changed.
- Effort labels may hide different compute.
highon one release may not represent the same work ashighon the next. - Some Claude rows carry a fallback label. AA does not define that label on the model leaderboard, so I could not verify its effect on latency. It cannot explain the whole pattern: GPT-6.1 Sol has no such label and still rose 2.2 to 3.2 times at high and max.
- The leaderboard times single prompts. It does not include your tool calls, failed attempts, or review loop.
A slower call can still finish a task sooner if the model needs fewer calls. The reverse can also happen:
task time ≈ model calls × wait per call + tool time + review time
AA does not report calls per task for our workflow. We have to measure that multiplier ourselves.
Implementation: run a four-arm pilot
Start with one row per completed task:
task_id,arm,model,effort,started_at,merged_at,model_calls,review_rounds,passed_first_tryRun the same task mix against four arms with the same acceptance tests and repository state:
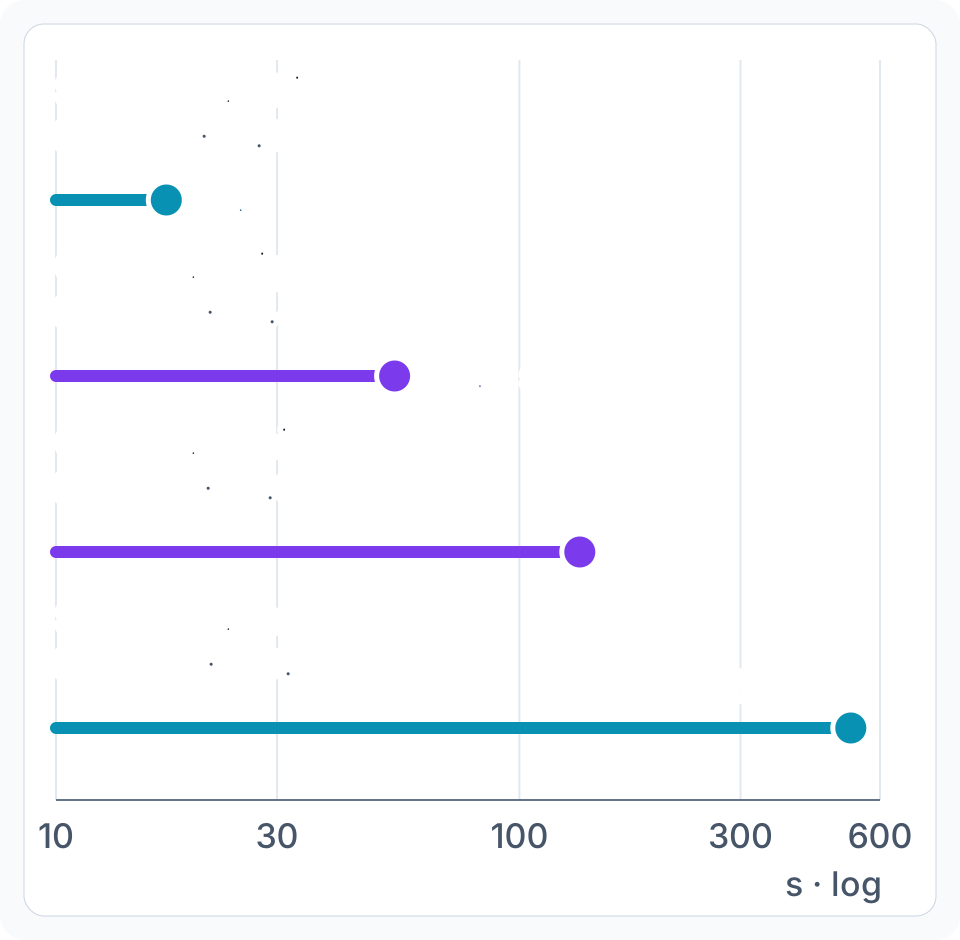
The four pilot arms using AA’s November 2 values. Cost means AA’s benchmark cost per Intelligence Index task, not the expected bill for a team coding task.
Pilot arm chart data
- Sonnet 5.5 high, floor test: Index 41, 17.3s, $1.64.
- Opus 5.5 high, +50 budget arm: Index 52, 53.8s, $3.46.
- Opus 5.5 xhigh, max challenger: Index 57, 135s, $6.05.
- Sonnet 5.5 max, incumbent: Index 54, 519s, $10.02.
Measure median minutes to merge and model calls alongside first-try pass rate and review rounds. A small pilot can expose large operational differences, but it cannot prove that pass rates are equivalent. If a five-point quality margin will drive the decision, calculate the sample size for that margin and report confidence intervals.
Pair similar tasks across arms when possible, and keep assignment rules fixed before the pilot starts. Otherwise one arm can inherit the harder work. Record failures and human interventions rather than discarding them; both are part of delivery time.
- Replace Sonnet max only if another arm meets the predeclared quality test and merges faster.
- Drop the +50 requirement for a task class if Sonnet high passes as often as the arms above the line.
- Keep max where it produces a clear pass-rate or review-round advantage.
flowchart TD
  P["Matched four-arm pilot: pass rate, calls, reviews, merge time"] --> Q{"Opus xhigh meets the quality gate?"}
  Q -->|yes| R{"Merges faster than Sonnet max?"}
  R -->|yes| S["Replace Sonnet max for this task class"]
  R -->|no| K["Keep Sonnet max"]
  Q -->|no| K
  P --> F{"Sonnet high matches the arms above 50?"}
  F -->|yes| D["Drop the +50 floor"]
  F -->|no| H["Keep the floor for this task class"]
Use measured delivery outcomes for both decisions. Re-run the pilot when the model, harness, or task mix changes.
For a fuller routing implementation, see How to Implement and Evaluate a Low-Effort Model Routing Policy.
Three results would change the starting policy:
- If max cuts calls or review rounds enough to keep merge time flat, its slower calls are not slowing delivery.
- If Opus xhigh misses the agreed quality margin, keep Sonnet max for the task classes where it wins.
- If a same-version medium row above 50 becomes much slower than medium rows below 50, revisit the claim that effort matters more than the floor.
Where this leaves us
Stop routing on the Index score alone. As a pilot hypothesis, start routine work at high, test xhigh for larger changes, and reserve max for tasks where it improves outcomes enough to offset the wait. Team results should overrule that allocation. Calls per task and minutes to merge—not the leaderboard—should choose the setting.
Related Reading
- Do We Need Deep Thinking? Why Fable 5.1 and Astra Look Smart and Gemini 3.8 Flash Looks Dumb: the per-prompt case for effort, and when extra thinking hurts.
- What to Expect From Every New LLM Version: A Field Guide for the Next Upgrade: what changes between releases, and how to attribute surprising behavior.
Sources
- Artificial Analysis, LLM leaderboard, observed 2026-11-02. Index v5.0, end-to-end time, first-chunk latency, output speed, and cost per task. These values change; the figures here are the 2026-11-02 observations.
- Artificial Analysis, leaderboard captures: 2026-04-16, 2026-06-16, 2026-08-16, 2026-10-16.
- Artificial Analysis, Language Model API Performance Benchmarking Methodology, version 2.2.0 dated 2026-03-02. Definitions, and the 72-hour median for standard workloads.
- Artificial Analysis, Intelligence Benchmarking Methodology. Index version history.
- Artificial Analysis, Announcing Artificial Analysis Intelligence Index v5, 2026-10-27.
- Artificial Analysis, home page, observed 2026-11-02. The cost-per-task definition.
- Anthropic, Introducing Claude Opus 5.5, 2026-09-22. Output speed claim.